Core Web Vitals: The Developer’s Complete Guide (2026)
If you build web apps for a living, Core Web Vitals are no longer optional. Google bakes them into its Page Experience signal, which means a sluggish JavaScript bundle or a layout that jumps around can quietly cost you rankings against competitors with worse content but tighter performance. For React, Next.js, Angular, and Vue developers, the stakes are higher because single-page apps introduce performance traps that traditional sites never face.
This guide is for web app developers, SaaS founders, and solo builders who write code and ship it themselves. We will cover what each metric measures, exactly how to fix poor scores with code examples you can paste into your own project, and the SPA-specific issues that other guides skip. By the end, you will know how to measure Core Web Vitals, fix them in framework-specific ways, set up real user monitoring, and understand how the metrics actually feed into Google’s ranking algorithm.
What Are Core Web Vitals?
Core Web Vitals are three user-experience metrics Google uses to evaluate page quality: Largest Contentful Paint (LCP) measures loading speed, Interaction to Next Paint (INP) measures responsiveness, and Cumulative Layout Shift (CLS) measures visual stability. Together they form part of Google’s Page Experience ranking signal, with scores calculated from the 75th percentile of real Chrome user data over a 28-day window.
Core Web Vitals are Google’s attempt to quantify whether a page actually feels fast and stable to a real human visitor. Synthetic load times alone do not capture frustration, so Google picked three metrics that each isolate one part of the user experience.
Largest Contentful Paint (LCP) answers the question: how long until the user sees the main content? It tracks when the largest visible element in the viewport finishes rendering, whether that is a hero image, a video poster frame, or a large block of text.
Interaction to Next Paint (INP) answers: when the user clicks, types, or taps, how long until the page visibly responds? INP replaced First Input Delay (FID) as a Core Web Vital in March 2024 because FID only measured the first interaction. INP looks at every interaction during a visit and reports the worst one (or close to it), which gives a much more honest picture of responsiveness on JavaScript-heavy pages.
Cumulative Layout Shift (CLS) answers: does content jump around while the user reads? It sums up unexpected layout movements, with each shift scored by how much of the viewport moved and how far.
Google chose these three metrics because each one maps to a specific user complaint. Slow loading, sluggish input, and content that jumps under the reader’s thumb are the three failures users notice most reliably. The metrics are designed as proxies for user satisfaction rather than abstract performance numbers.
One detail trips up most developers: your score is the 75th percentile of real-user measurements across a 28-day rolling window. That means 75% of your users need to experience LCP at or below 2.5 seconds for the URL to count as “good.” A handful of fast lab tests on your own MacBook with a wired connection are not the data Google uses. Field data from Chrome users on real devices and networks is what determines your score.
Largest Contentful Paint (LCP)
What Is LCP?
LCP measures the render time of the largest image, video poster, or text block visible within the viewport, relative to when the page first started loading. The “largest” element is whichever takes up the most pixels above the fold at the moment it appears.
Common LCP elements include:
<img>tags, including responsive images served viasrcset<video>poster frames (the still image shown before playback starts)- Background images loaded via CSS
background-image - Block-level text containers with large amounts of text or a tall headline
The thresholds Google uses are:
- Good: 2.5 seconds or less
- Needs Improvement: 2.5 to 4.0 seconds
- Poor: over 4.0 seconds
Common Causes of Poor LCP
LCP problems almost always trace back to one of four root causes. The first is slow server response time. If your Time to First Byte (TTFB) is already 800ms, you are starting LCP measurement on a four-second clock with most of the budget gone. SSR pages that hit a slow database, edge functions with cold starts, and overloaded origin servers all bleed into LCP.
The second cause is render-blocking resources. Synchronous CSS in the head, large JavaScript bundles loaded before the first paint, and external fonts without font-display all stall the browser before it can render anything.
The third cause is slow resource load times for the LCP image itself. Unoptimized JPEGs at 2MB, images served at desktop dimensions to mobile devices, and missing CDN configuration can add several seconds.
The fourth cause, and the one that hits SPA developers hardest, is client-side rendering delay. If your React or Vue app renders the hero image after the JavaScript bundle downloads, parses, and executes, your LCP is bound by your bundle size. A 500KB JavaScript bundle on a mid-tier Android phone can add 1.5 to 3 seconds before any content is painted.
How to Fix LCP
The single highest-impact fix is preloading the LCP image. Tell the browser to fetch it as early as possible, in parallel with the HTML parsing.
<link rel="preload" as="image"
  href="/hero-1280.webp"
  imagesrcset="/hero-640.webp 640w, /hero-1280.webp 1280w"
  imagesizes="100vw"
  fetchpriority="high">
The fetchpriority attribute also works directly on the image tag, which is useful when the LCP element is rendered by JavaScript and you cannot easily inject a preload tag.
<img src="/hero.webp"
  width="1280" height="720"
  fetchpriority="high"
  alt="Product dashboard screenshot">
Switch image formats from JPEG and PNG to WebP or AVIF. WebP is roughly 25-35% smaller than equivalent JPEG, and AVIF can shave another 20% off WebP. Modern browsers support both natively, with PNG fallbacks handled through the <picture> element.
In Next.js, the next/image component handles most of this for you. It auto-generates responsive srcset entries, serves WebP/AVIF when supported, and sets explicit dimensions to prevent layout shift. Use the priority prop on the LCP image to tell Next.js to preload it.
import Image from 'next/image';

export default function Hero() {
  return (
    <Image
      src="/hero.png"
      alt="Product dashboard"
      width={1280}
      height={720}
      priority
      sizes="(max-width: 768px) 100vw, 1280px"
    />
  );
}
For server-rendered React apps without Next.js, hand-roll the preload tag and set fetchpriority="high" on the hero image. If you ship a pure client-rendered React app, the LCP element will not exist in the initial HTML, so the browser cannot preload it. Either move to server-side rendering, use a static HTML shell with the hero image inlined, or accept that LCP will suffer until the bundle hydrates. For deeper framework treatment, our guide on React SEO walks through SSR strategies in detail.
TTFB matters too. If your application server takes 600ms to respond, no amount of image optimization will get you under 2.5 seconds. Move static assets to a CDN, cache HTML at the edge (Vercel, Cloudflare Workers, Netlify Edge), and audit your database queries on the route that serves your most-trafficked page. Edge caching frequently turns a 1.2-second TTFB into a 50ms one.
For React-specific optimization, watch out for hydration-delayed LCP elements. If your hero image is wrapped in a component that only renders after useEffect or a state hook resolves, the image will not appear until hydration completes. Render the LCP element on the server, statically, with no conditional logic that requires client-side state.
Interaction to Next Paint (INP)
What Is INP?
INP measures the latency between a user interaction (click, tap, key press) and the next visual update the browser paints. It captures every qualifying interaction during a page visit and reports a representative value, generally the worst one or the 98th percentile if there are many interactions.
INP replaced FID in Core Web Vitals in March 2024. The change matters because FID only measured the delay before the browser could start processing the first interaction, which made FID look great even on pages that were horribly sluggish after the initial click. INP captures the full picture, from input start through script execution to the next paint, and it does so across every interaction, not just the first.
The thresholds are:
- Good: 200 milliseconds or less
- Needs Improvement: 200 to 500 milliseconds
- Poor: over 500 milliseconds
What Causes Poor INP
The root cause of poor INP is almost always main thread work. JavaScript runs on a single thread in the browser, and while that thread is busy with a long task, the browser cannot respond to user input or paint a new frame. Anything that holds the main thread for more than 50ms is a candidate problem.
Heavy event handlers are the most common offender. A click handler that runs a synchronous loop over 10,000 items, parses a large JSON blob, or triggers a React state update that re-renders a list of 500 components will easily exceed the 200ms budget.
React re-renders are particularly nasty because a single state change can cascade through the component tree. If a parent component re-renders on every keystroke and that parent has 200 children, each keystroke pays the cost of reconciling all 200, even when only one needs updating.
Third-party scripts make INP unpredictable. Analytics tags, A/B testing libraries, chat widgets, and ad scripts can each schedule long tasks that block your interactions. The worst part is you usually have no control over their internals.
Synchronous layout recalculations (forced reflows) cause subtle INP regressions. Reading element.offsetWidth after a write to the DOM forces the browser to recalculate layout immediately, even if it had work batched for later.
How to Fix INP
Break up long tasks. If your click handler does heavy work, yield to the browser between chunks so it can paint and process other input.
async function processLargeList(items) {
  for (let i = 0; i < items.length; i++) {
    processItem(items[i]);
    if (i % 50 === 0) {
      // Yield to the browser to handle pending input + paint
      await new Promise(resolve => setTimeout(resolve, 0));
    }
  }
}
The modern API for this is scheduler.yield(), which gives finer control and puts pending user input first over over your continuation. It is available in Chrome 129+ and behind a flag elsewhere, so feature-detect and fall back to setTimeout.
async function yieldToMain() {
  if ('scheduler' in window && 'yield' in scheduler) {
    return scheduler.yield();
  }
  return new Promise(r => setTimeout(r, 0));
}
Debounce expensive handlers on input events. A search-as-you-type input that fires a filter operation on every keystroke is a classic INP killer. Wait for the user to pause typing before running the heavy work.
function debounce(fn, delay) {
  let timer;
  return (...args) => {
    clearTimeout(timer);
    timer = setTimeout(() => fn(...args), delay);
  };
}

const handleSearch = debounce((query) => {
  filterResults(query);
}, 150);
React has two purpose-built hooks for this: useDeferredValue and useTransition. Both tell React to treat the update as non-urgent, which lets the browser paint user input before running the expensive re-render.
import { useState, useTransition } from 'react';

function SearchBox({ items }) {
  const [query, setQuery] = useState('');
  const [results, setResults] = useState(items);
  const [isPending, startTransition] = useTransition();

  const handleChange = (e) => {
    setQuery(e.target.value); // urgent: keeps input snappy
    startTransition(() => {
      setResults(filterItems(items, e.target.value));
    });
  };

  return (
    <>
      <input value={query} onChange={handleChange} />
      {isPending ? <Spinner /> : <Results items={results} />}
    </>
  );
}
The input update happens immediately, so the user sees their keystrokes paint without delay. The expensive filter runs inside startTransition, which React schedules at a lower priority and can interrupt if more input arrives.
Avoid forced reflows by separating reads from writes. Read all the layout properties you need first, then perform all DOM writes in a batch.
// Bad: causes forced reflow on every iteration
elements.forEach(el => {
  el.style.width = (el.offsetWidth + 10) + 'px';
});

// Good: read all widths, then write all widths
const widths = elements.map(el => el.offsetWidth);
elements.forEach((el, i) => {
  el.style.width = (widths[i] + 10) + 'px';
});
Defer non-critical third-party scripts. Move analytics, chat widgets, and ad tags to load after the page is interactive. In Next.js, the next/script component with strategy="lazyOnload" or strategy="afterInteractive" handles this cleanly.
Cumulative Layout Shift (CLS)
What Is CLS?
CLS measures the sum of all unexpected layout shifts over the lifetime of a page. Each shift score is calculated by multiplying the impact fraction (how much of the viewport moved) by the distance fraction (how far the elements moved). The metric is unitless and lower is better.
The thresholds are:
- Good: 0.1 or less
- Needs Improvement: 0.1 to 0.25
- Poor: over 0.25
Note that CLS only counts unexpected shifts. Shifts triggered by user interaction within 500ms (clicking a “Load more” button, expanding an accordion) are excluded. Animations driven by CSS transform are also exempt because they do not affect layout.
Common Causes of CLS
The most common cause is images without explicit width and height attributes. When the browser starts laying out the page, it reserves zero space for an image whose dimensions are unknown. Once the image header downloads, the browser learns its size and pushes all the content below it down.
Web fonts cause Flash of Unstyled Text (FOUT) or Flash of Invisible Text (FOIT). When the custom font loads, the text reflows because the new font has different metrics than the fallback. If the difference is large, paragraphs change height and surrounding content shifts.
Dynamically injected content is the third major cause. Cookie consent banners that slide in from the top, ads that load late and push the article down, social media embeds, newsletter signup popups, and even some chat widgets all push the page around after the user has already started reading.
Iframes and embeds without reserved space behave similarly to images. A YouTube embed loads asynchronously and inserts itself into a container that had no height, shifting everything below.
How to Fix CLS
Always set explicit width and height attributes on image tags. Modern browsers use these as an aspect ratio hint and reserve space proportionally even when the rendered size differs.
<img src="/photo.webp"
  width="1200" height="800"
  alt="Conference room"
  style="width: 100%; height: auto;">
The browser sees the 1200×800 ratio, calculates the aspect ratio as 1.5:1, and reserves a placeholder of the correct shape before the image downloads. When the image arrives, it fills the placeholder with zero shift.
For responsive containers where you cannot know the dimensions in advance, use the CSS aspect-ratio property to lock in the shape.
<div class="video-wrapper">
  <iframe src="https://www.youtube.com/embed/..."
    title="Demo video"></iframe>
</div>

<style>
.video-wrapper {
  aspect-ratio: 16 / 9;
  width: 100%;
}
.video-wrapper iframe {
  width: 100%;
  height: 100%;
}
</style>
For web fonts, use font-display: optional on critical fonts to avoid layout shift entirely. Optional tells the browser to use the custom font only if it is already cached or loads within 100ms; otherwise it sticks with the fallback for the entire page load. This trades a slightly less branded first visit for zero CLS from font swapping.
<style>
@font-face {
  font-family: 'Inter';
  src: url('/fonts/inter.woff2') format('woff2');
  font-display: optional;
}
</style>
For cases where you need the custom font on first paint, use font-display: swap combined with size-adjust and ascent-override CSS descriptors to match the metrics of the fallback font, which makes the swap almost invisible.
Reserve space for dynamically injected content with a placeholder. If you know an ad slot will be 300×250, render an empty 300×250 div before the ad script loads.
<div class="ad-slot" style="min-height: 250px; width: 300px;">
  <!-- ad script injects here -->
</div>
For cookie consent banners and other notifications, position them with position: fixed at the bottom of the viewport. They overlay content instead of pushing it.

Core Web Vitals Thresholds at a Glance
| Metric | Measures | Good | Needs Improvement | Poor |
|---|---|---|---|---|
| LCP | Loading performance | ≤ 2.5s | 2.5s to 4.0s | > 4.0s |
| INP | Interactivity | ≤ 200ms | 200ms to 500ms | > 500ms |
| CLS | Visual stability | ≤ 0.1 | 0.1 to 0.25 | > 0.25 |
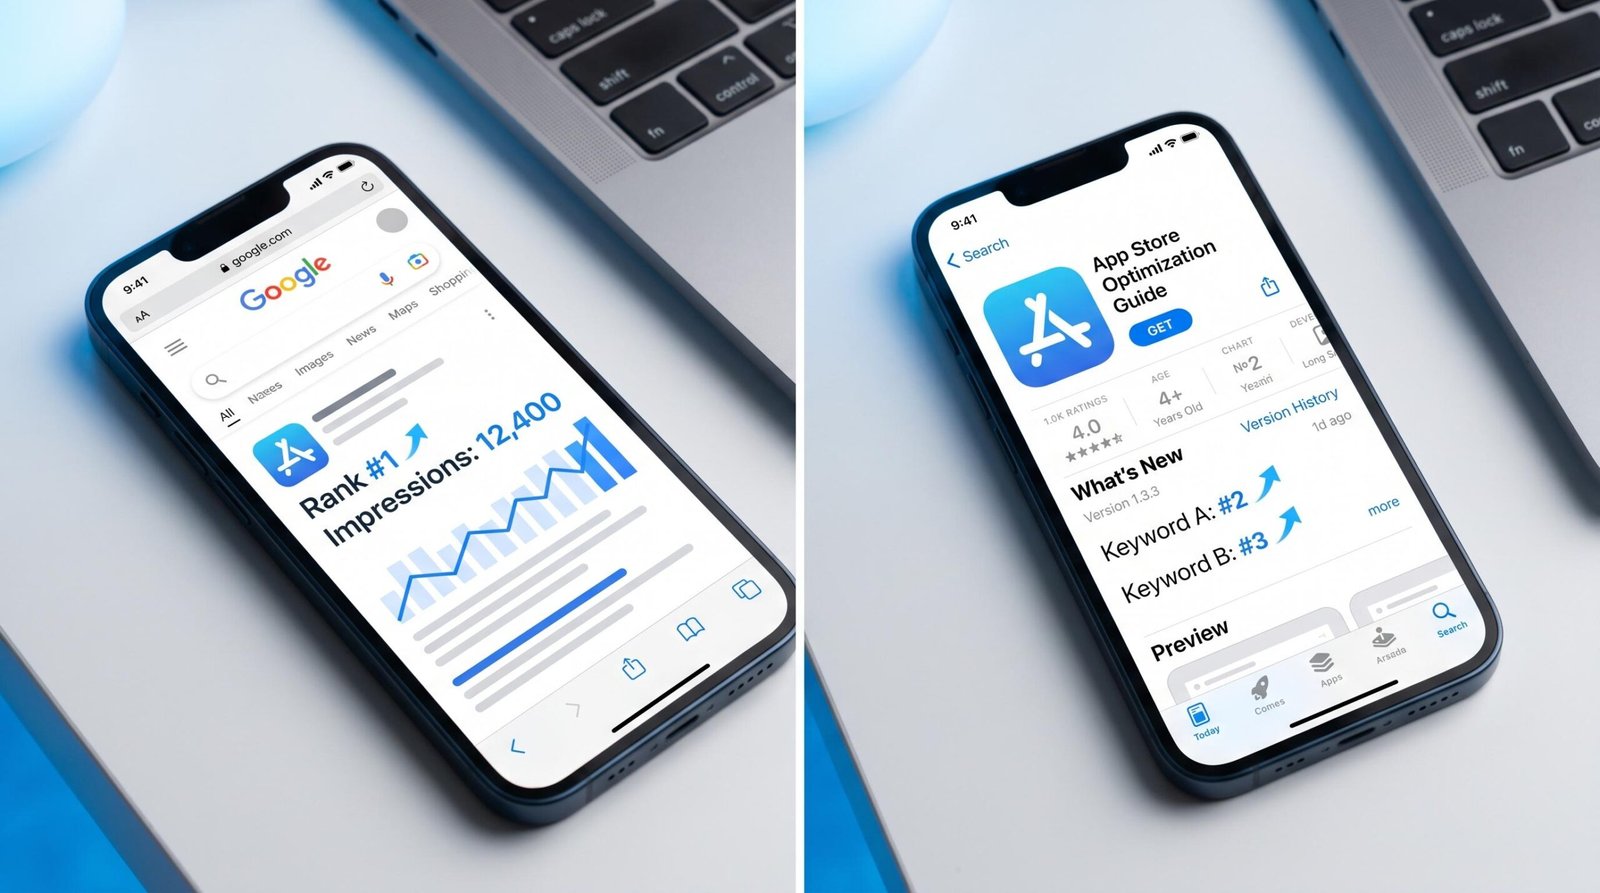
How Core Web Vitals Affect SEO Rankings
Core Web Vitals are part of Google’s Page Experience signal, which Google describes in detail in Google’s official Core Web Vitals documentation. The signal is real but it is not a magic ranking dial. Treat CWV as a tiebreaker between pages with similar topical relevance. Great content on a slow page will usually outrank weak content on a fast page, but if two pages are evenly matched on relevance and authority, the one with better Core Web Vitals wins.
The 75th percentile threshold has a subtle implication that most developers miss. Google groups your URLs by similar structure and evaluates whether 75% of visits to that group meet the “good” threshold. You do not need every page to be perfect, but you need consistency. A single fast homepage with a dozen slow blog posts will still flag your blog group as poor.
Mobile and desktop scores are evaluated separately, and Google primarily uses the mobile score for ranking under mobile-first indexing. If your mobile LCP is poor because your hero image is too large for slow connections, Google will use that mobile score even when a user searches from desktop. Optimize for mobile first, always.
The data Google uses for ranking is the field data from the Chrome User Experience Report (CrUX), not the lab data from PageSpeed Insights. Field data reflects actual users on actual networks and devices. A site can score 100 in Lighthouse on a developer laptop and still fail the CrUX threshold because its real audience uses 3G phones in suburban coverage gaps. The Core Web Vitals report in Google Search Console is the closest view you get to the field data Google actually uses.
Core Web Vitals also feed into Google Discover eligibility and AMP-equivalent fast-loading badges in some search features. While the direct ranking weight is modest, the secondary effects (better user engagement, lower bounce rate, higher conversion) compound over time. We have seen sites recover 15-20% of organic traffic after fixing a poor LCP score, not because Google bumped them in rankings, but because users finally stayed on the page long enough to convert into citations and backlinks.
Lab Data vs Field Data: Why Your Scores Differ
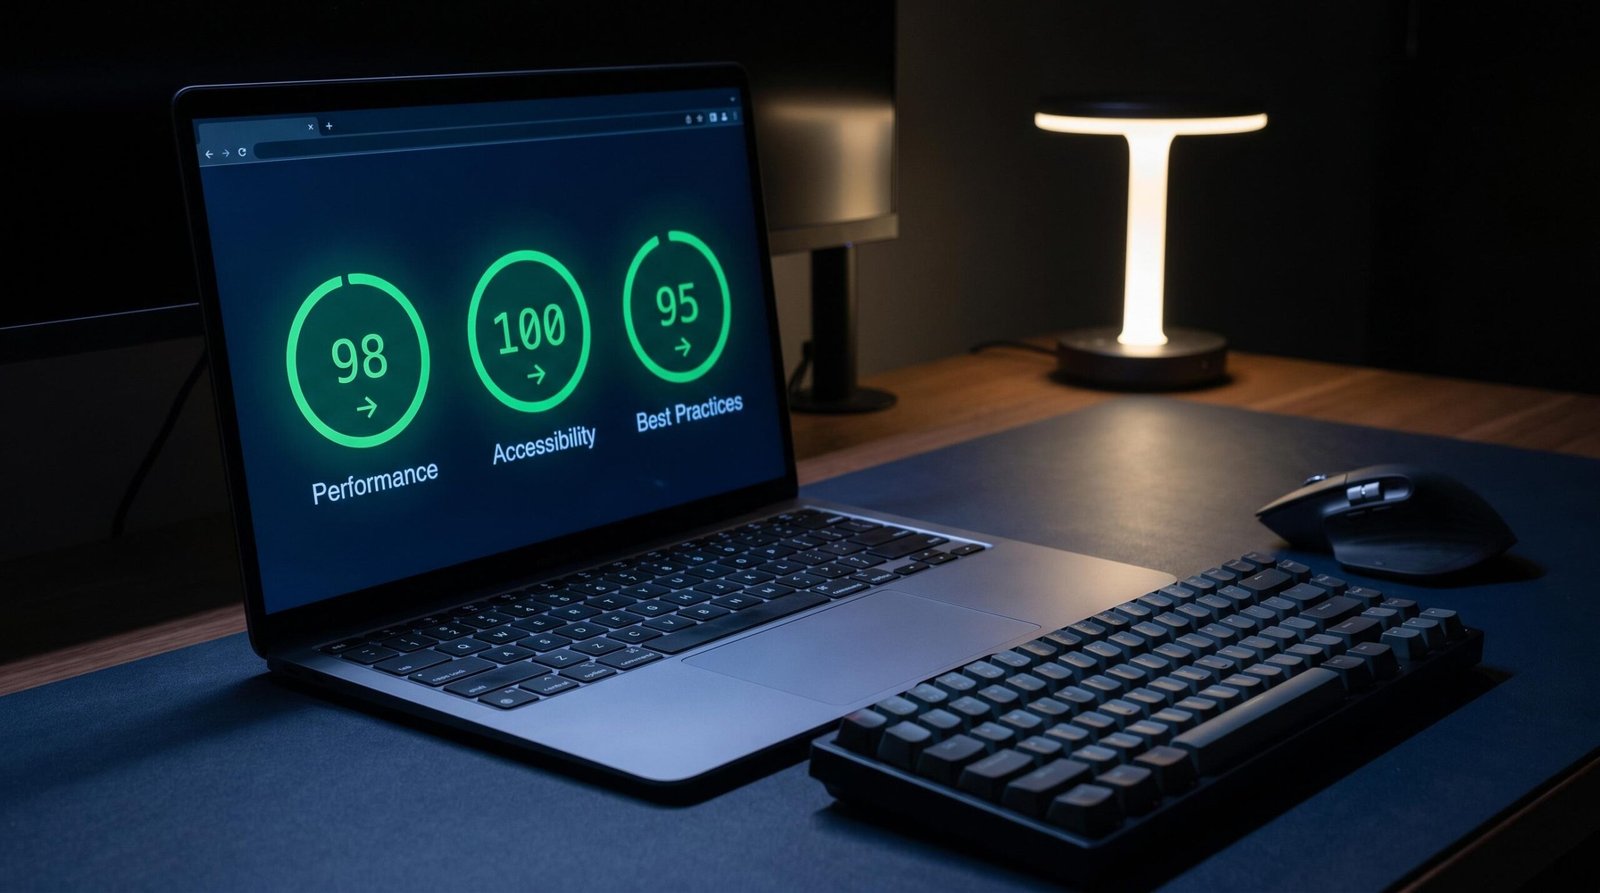
Lab data is a synthetic measurement collected in a controlled environment. PageSpeed Insights runs your page through a virtual machine with predefined network throttling (4G) and a mid-tier mobile CPU simulation. The result is deterministic and fast, which makes it ideal for debugging and before/after comparisons.
Field data is collected from real Chrome users who have opted into the CrUX dataset, anonymized and aggregated over a 28-day rolling window. The data Google uses for ranking is field data. Lab data is not what determines your rank.
You need both. Use lab data when you change one variable and want to know whether it helped. Lab data is also the only option when CrUX has not collected enough samples for your URL (more on that below). Use field data to confirm that your lab improvements actually moved the needle for real users.
Lab and field scores frequently disagree, and the most common reason is that your lab test runs on faster hardware and a more predictable network than your real users have. A 350ms TTFB in the lab can be 1.2 seconds for a user in Mumbai connecting via mobile. Cache states differ: lab tests run with a cold cache, while many real users have your CSS and fonts already cached from a previous visit. Third-party scripts behave differently in production where ad auctions, geolocation, and consent state introduce variance.
The new site problem is the most frustrating gap. CrUX requires enough Chrome users to visit your URL before it generates field data, typically thousands of visits per origin per month. New sites and low-traffic SaaS dashboards often show “Insufficient data” in PageSpeed Insights and the Search Console CWV report. In that case, lab data is your only option until traffic grows. Optimize on lab data and trust that the same fixes will improve real-user scores once they are measurable.
Tools to Measure Core Web Vitals
Several tools cover Core Web Vitals, each with different strengths. The table below shows which to reach for in which situation.
| Tool | Data type | Device | Best for |
|---|---|---|---|
| PageSpeed Insights | Lab + field | Mobile + desktop | One-off page audits |
| Google Search Console CWV report | Field | Mobile + desktop | Site-wide tracking |
| Chrome DevTools Performance panel | Lab | Local browser | Debugging specific interactions |
| web-vitals Chrome extension | Lab (local) | Local browser | Real-time score overlay |
| web.dev/measure | Lab | Simulated | Quick visual report |
| web-vitals.js library | Field (your users) | Real users | Custom RUM dashboards |
PageSpeed Insights remains the default starting point. It is free, requires no setup, and shows both lab and field data side by side. The diagnostics panel suggests specific fixes for each failing metric, and the field data section confirms how real users experience the URL.
The Search Console CWV report gives you the site-wide view. It groups URLs by similar performance characteristics and shows how many of each group are good, need improvement, or poor. The trend chart is the fastest way to see whether a recent deploy moved the field-data needle.
Chrome DevTools is irreplaceable for INP debugging. Record a Performance trace while you click through a slow interaction, expand the long tasks in the flame chart, and you will see exactly which scripts hold the main thread. The Interactions section of the trace pinpoints each user input with its delay, processing time, and presentation delay broken out separately.
The web-vitals Chrome extension overlays a small panel in the bottom corner of any page with live LCP, INP, and CLS scores as you browse. It is useful for quick spot checks while developing or while auditing a competitor site.
web.dev/measure is essentially a wrapper around PageSpeed Insights with a friendlier presentation. The web.dev’s Web Vitals reference is the authoritative deep-dive on each metric and is worth bookmarking.
Core Web Vitals for JavaScript Apps and SPAs
Single-page apps break some of the assumptions Core Web Vitals were built on, and this is where most developer guides stop being useful. A traditional multi-page site triggers a full document navigation on every URL change, which resets all CWV metrics for the new page. SPAs use the History API to swap content without reloading, and the browser does not treat that as a new page for measurement purposes.
The practical consequence is that LCP, INP, and CLS are reported per page load, not per route change. If a user lands on your homepage, then navigates to /pricing, then to /docs, the entire session is one CWV measurement window. Any layout shifts on /pricing add to the CLS score Google attaches to /. Long tasks during the route transition to /docs get counted against the homepage URL.
Google is working on soft navigation support for Core Web Vitals, which would measure each route change as its own page load. As of mid-2026 this remains experimental and opt-in via the soft-navigation web-vitals.js attribution build. Until it stabilizes, your CrUX data treats SPA sessions as monolithic.
The implication for measurement is that you should test CWV on every major route as if it were a cold entry point, not just the homepage. Direct-link to /pricing with a cleared cache and test it as its own page. Real users often enter your app from deep links found in search results, so the per-route landing experience matters more than the transition experience.
React-specific patterns that hurt CWV include rendering the entire app inside a single root component that re-renders on any state change, using useEffect for data fetching that the user is waiting on (which delays LCP), and large client-side route components that block hydration. The fixes are server-side rendering with streaming, code-splitting at the route level with React.lazy or framework router primitives, and moving data fetching above the component tree (loaders in React Router, server components in Next.js).
Next.js handles most of this if you adopt the App Router and server components. Static and server-rendered pages produce HTML with the LCP element already in place, which lets the browser preload it before JavaScript executes. The streaming model also lets the page paint progressively, which means LCP fires when the hero content arrives even if the rest of the page is still streaming. For a fuller treatment of framework patterns, see our guide on Next.js SEO.
Angular has its own performance considerations, primarily around change detection and zone.js overhead. Angular’s standalone components and signals (stable since Angular 17) reduce the change-detection cost significantly. OnPush change detection on heavy components prevents unnecessary re-renders that would otherwise hurt INP.
Vue 3 with the Composition API gives you fine-grained reactivity that can outperform React on INP for equivalent UIs, because Vue updates only the components that depend on a changed reactive value. Nuxt 3 plays a similar role to Next.js, with SSR and partial hydration that keep LCP under control.
Across all SPA frameworks, the highest-impact CWV intervention is reducing JavaScript bundle size. A 200KB bundle on a mid-tier Android device takes roughly 600ms to parse and compile before any of your code runs. Code-split aggressively, lazy-load routes, and audit your dependency tree for accidental inclusion of utility libraries you barely use. Our guide on SEO for web apps covers the broader picture of how performance and indexability interact for JavaScript-heavy sites.
How to Set Up Real User Monitoring for Core Web Vitals
Lab data lies to you eventually. Sooner or later you will ship a change that looks great in PageSpeed Insights and tanks your field scores because some real-user condition (a specific browser, a particular network, a regional CDN edge) exposed a regression the synthetic test missed. The fix is real user monitoring (RUM), which captures CWV from your actual visitors.
The Google-maintained web-vitals npm package is the canonical RUM library. Install it with npm install web-vitals and import the metric functions you need.
import { onCLS, onINP, onLCP, onFCP, onTTFB } from 'web-vitals';

function sendToAnalytics({ name, value, id, rating }) {
  // The Beacon API is preferred so the request survives page unload
  const body = JSON.stringify({ name, value, id, rating });
  if (navigator.sendBeacon) {
    navigator.sendBeacon('/analytics/vitals', body);
  } else {
    fetch('/analytics/vitals', { body, method: 'POST', keepalive: true });
  }
}

onCLS(sendToAnalytics);
onINP(sendToAnalytics);
onLCP(sendToAnalytics);
Each metric function fires its callback when the metric is finalized for the page. CLS finalizes on page hide, INP updates throughout the session, and LCP finalizes shortly after the largest element renders or on first interaction.
To send the data to Google Analytics 4, route the callback through gtag as an event.
import { onCLS, onINP, onLCP } from 'web-vitals';

function sendToGA4({ name, delta, id, rating, value }) {
  gtag('event', name, {
    value: Math.round(name === 'CLS' ? delta * 1000 : delta),
    metric_id: id,
    metric_value: value,
    metric_rating: rating,
    metric_delta: delta,
  });
}

onCLS(sendToGA4);
onINP(sendToGA4);
onLCP(sendToGA4);
GA4 will then expose these as custom events you can analyze in the Explore reports. Filter by metric name and chart the 75th percentile of metric_value to mirror what Google evaluates for ranking.
For more granular debugging, import the attribution build (web-vitals/attribution) instead. It includes additional fields that tell you which element caused poor LCP, which event handler caused poor INP, and which DOM node caused the largest layout shift. Send those attribution fields to your analytics platform and you will have direct evidence of which component on which page needs work.
RUM matters more than lab scores for SEO because field data is the data Google uses for ranking. If your Search Console CWV report disagrees with your PageSpeed Insights lab scores, trust the field data and dig until you find what your real users hit that your lab does not. RUM also gives you per-page breakdowns that PageSpeed Insights does not, which is critical when your SPA has dozens of distinct route templates that each behave differently. For sites where measurement starts to overlap with content quality, our guide on on-page SEO covers how page performance and content optimization reinforce each other.
Core Web Vitals Quick Wins, Ranked by Impact
If you are looking at a failing CWV report and need to know where to start, work this list from top to bottom. Each fix is ordered by impact-to-effort ratio, so the highest payoffs come first.
| Fix | Metric | Impact | Effort |
|---|---|---|---|
| Add fetchpriority=”high” to LCP image | LCP | High | Low |
| Set explicit width/height on all images | CLS | High | Low |
| Preload LCP image via <link rel=”preload”> | LCP | High | Low |
| Switch to next/image (Next.js) | LCP + CLS | High | Medium |
| Use font-display: optional | CLS | Medium | Low |
| Debounce heavy click handlers | INP | Medium | Medium |
| Use useTransition for non-urgent React updates | INP | High | Medium |
| Audit and defer third-party scripts | INP + LCP | High | Medium |
| Compress images to WebP/AVIF | LCP | High | Medium |
| Reserve space for ads/embeds | CLS | Medium | Low |
Once the quick wins are in place, the next layer of improvement usually requires architectural changes: moving from client-side to server-side rendering, restructuring data fetching, or splitting bundles more aggressively. We suggest running a full technical SEO audit at that point to surface the broader performance and indexability issues that compound with Core Web Vitals.
Frequently Asked Questions
Are Core Web Vitals a direct ranking factor?
Yes, Core Web Vitals are part of Google’s Page Experience signal, which is a confirmed ranking factor. The weight is modest compared to content relevance and link authority, but in competitive niches where pages are evenly matched on those signals, Core Web Vitals can act as a tiebreaker. Field data from the Chrome User Experience Report is what Google uses, not lab data.
Do Core Web Vitals scores differ between mobile and desktop?
Yes, Google measures and evaluates mobile and desktop scores separately. Under mobile-first indexing, the mobile score is the one that primarily affects rankings, even for desktop searches. Mobile scores are almost always worse because real-world mobile networks and CPUs are slower than desktop equivalents. Always optimize for mobile first.
What replaced FID in Core Web Vitals?
Interaction to Next Paint (INP) replaced First Input Delay (FID) in March 2024. FID only measured the delay before the browser could begin processing the first interaction, which made many slow pages look responsive. INP measures the full latency from input to the next visual paint and considers every interaction during a visit, giving a more honest picture of how a page feels under sustained use.
What is the 75th percentile rule in Core Web Vitals scoring?
Google evaluates Core Web Vitals at the 75th percentile of real-user data over a 28-day rolling window. To earn a “good” rating, 75% of visits to a URL group must experience metric values at or below the good threshold. This means you cannot optimize for the median user and call it done. The slowest quarter of your traffic determines whether you pass.
How long does it take for Core Web Vitals improvements to show in Google Search Console?
The CrUX dataset uses a 28-day rolling window, so a fix you ship today will take roughly four weeks to fully reflect in your field data. You will see partial improvement after a few days as new measurements blend with older ones, but the full effect takes about a month. Search Console updates its report every few days, so check back weekly to track the trend.
How do I check Core Web Vitals for a site without enough real-user data?
If CrUX shows “Insufficient data” because your site has low traffic, you can rely on lab data from PageSpeed Insights, Lighthouse, or web.dev/measure. These tools run synthetic tests that simulate a mid-tier mobile device on a 4G connection. Lab scores are not the data Google uses for ranking, but they are reliable indicators of how field data will look once traffic grows. Setting up RUM with the web-vitals.js library also captures your own visitors’ real experience even before CrUX has enough samples.
Do Core Web Vitals affect Google Ads quality score?
Landing page experience is one of the inputs to Google Ads quality score, and Core Web Vitals are part of how Google evaluates landing page experience. A slow LCP or high CLS can lower your quality score, which raises your cost per click and lowers your ad rank. The effect is indirect (CWV influences page experience, which influences quality score), but improving Core Web Vitals usually pays off in lower Google Ads costs as well as better organic rankings.